
Who’s actually clutch on Sunday? Eight years of PGA Tour data.
Published:
If you watch enough golf, you’ve absorbed a piece of folk wisdom: the leader after 54 holes plays worse on Sunday. The lead shrinks, the back nine eats people alive, and somebody you’d never bet on walks off with the trophy. Commentators reach for the word choke. Players reach for the word pressure. The flip side of the same coin is clutch: the player who shows up on Sunday and plays like the moment isn’t there.
I wanted to know whether you can see that pattern in the data — and, more importantly, whether the apparent gap between contenders and the rest of the field on Sunday is actually about handling pressure or just statistics doing what statistics do.
This is not a new question. Pope and Schweitzer (2011) used PGA ShotLink data to show that tour pros putt worse for birdie than for par on otherwise identical putts — a loss-aversion result that is the closest thing the literature has to a “smoking gun” for pressure-induced underperformance. Hickman and Metz (2015) showed that putting performance further deteriorates with the monetary stakes of the putt. What follows is a tournament-level cousin of those results, using publicly available leaderboard data and a within-player design.
Short answer: about nine-tenths of what looks like Sunday underperformance in contention is regression to the mean. A small, real cost-of-contention residual survives — averaging roughly four-tenths of a stroke. The “back-nine collapse” essentially does not exist. And individual players differ enough that you can pick out reliable names at both ends of the clutch distribution.
The pattern that gets people excited
I pulled every PGA Tour stroke-play event from 2018 through 2025 — 329 tournaments, 23,727 player-tournament observations after dropping non-completers, team events, and weather-shortened weeks. For each player at each tournament, I compute a “Sunday surprise”:
Δ = (Round 4 score to par) − (mean of Rounds 1–3 to par for that same player at that same event)
If you played consistently all week, Δ ≈ 0. If you played worse on Sunday, Δ > 0.
Sort players by where they stood after Round 3 and the pattern is enormous:
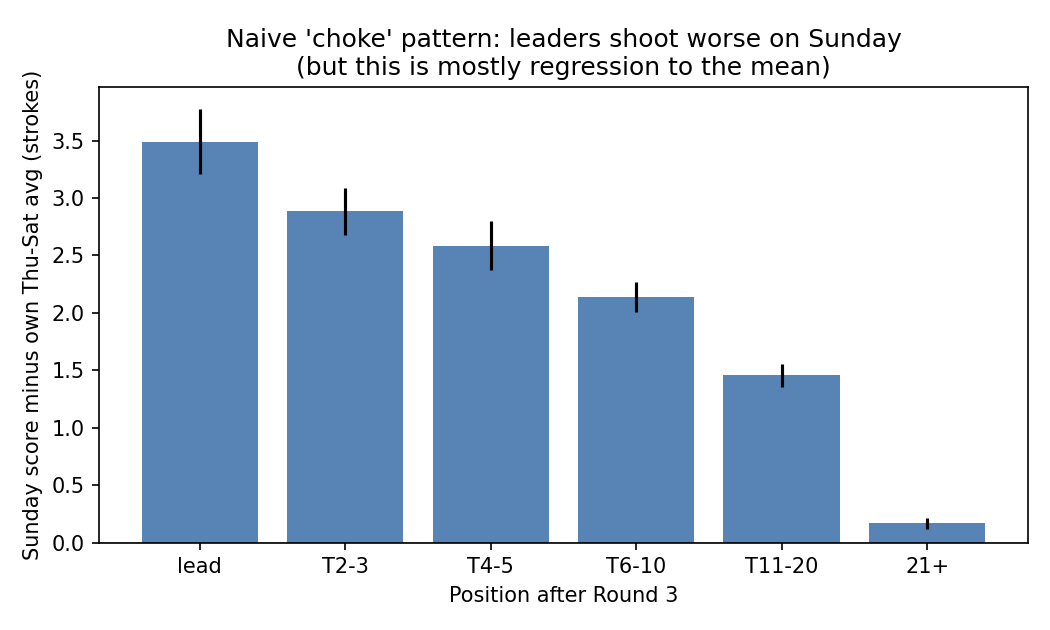
Leaders play their Sunday round 3.5 strokes worse than their own Thursday-through-Saturday average. The back-of-pack reference (players 21st or worse entering the round) plays essentially to form. Monotonically, the closer you are to the lead, the worse Sunday goes for you.
If you stopped here, you’d write the obvious headline. You’d be wrong.
Why the obvious headline is wrong
Leaders are leaders because they have just played three rounds well. Three rounds well in this sport requires a mix of skill and luck — making mid-range putts you usually miss, flying the right line off the tee with the wind shifting. By Saturday night, the player in the lead is by construction sitting on top of a hot streak that was always going to revert.
This is just regression to the mean. It doesn’t require any pressure, any psychology, any nerves. If you randomly reshuffled what shots fell on Thursday vs. Sunday, you’d still see the leaders shoot worse on Sunday on average, simply because the labels “leader” and “back-marker” select on the prior rounds.
So the question is: once we strip out regression to the mean, does anything remain?
The cleaner test
Within each event, I rank players by their through-R3 score to par. To separate leverage from regression to the mean, I run a fixed-effects regression of Δ on indicators for after-R3 position bins (Lead, T2–3, T4–5, T6–10, T11–20, vs. 21+ as the reference), while controlling flexibly for the player’s actual through-R3 score:
Δie = β · position_binie + γ · through_R3ie + δ · through_R3ie2 + αi + θe + εie
Player fixed effects (αi) absorb skill. Event fixed effects (θe) absorb course difficulty, weather, and field strength. The quadratic in through-R3 score is the workhorse that absorbs regression to the mean: among players with the same three-round score, position is determined by who else happens to be near them on the leaderboard. That residual variation in position — the part not driven by your own scoring — identifies the leverage effect.
Result:
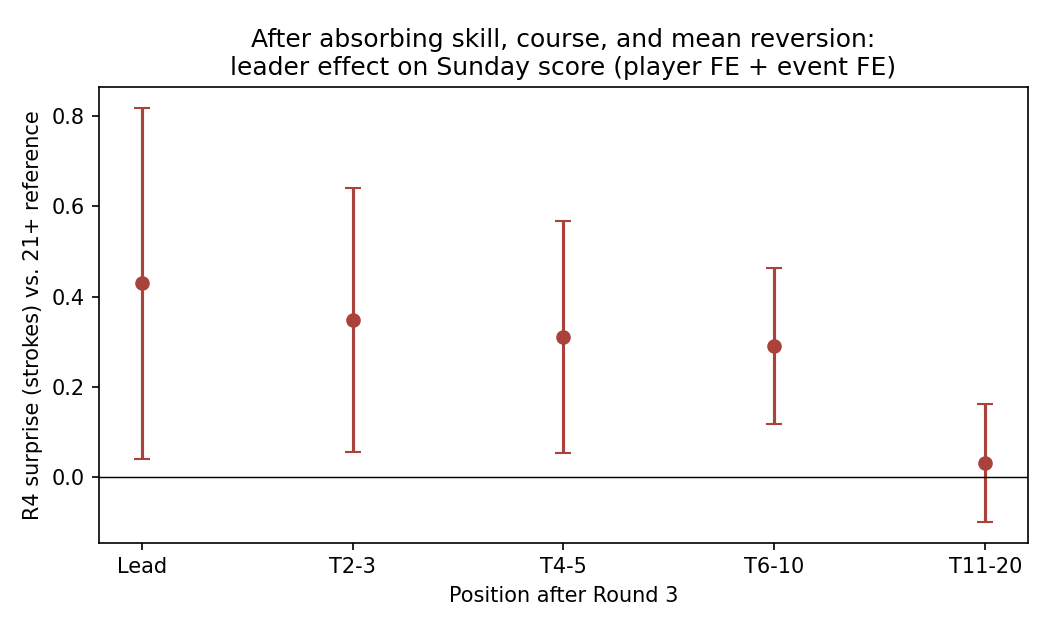
| Position after R3 | Naive Δ | Adjusted Δ |
|---|---|---|
| Lead | +3.49 | +0.43 (p = 0.03) |
| T2–3 | +2.89 | +0.35 (p = 0.02) |
| T4–5 | +2.58 | +0.31 (p = 0.02) |
| T6–10 | +2.14 | +0.29 (p < 0.01) |
| T11–20 | +1.46 | +0.03 (n.s.) |
Roughly 88 percent of the naive Sunday gap is mean reversion. But a real residual remains: players in the top 10 entering Sunday give back somewhere between 0.3 and 0.4 strokes relative to their own pace from earlier in the week, and the effect is significant. The leader cost (≈0.4 strokes) is essentially the same as the cost for T6–10, suggesting it’s “being in contention” that exacts the toll, not specifically “being in the lead.” Put another way: even the average tour pro gives back about four-tenths of a stroke to their own Thu–Sat form when they’re in contention on Sunday. The question that interests me is which players give back more — and which give back less, or none at all.
Sanity check: famous Sundays on the leaderboard
Before drawing conclusions from a regression coefficient, it helps to verify the data agree with everyone’s memory. A few well-known final rounds, with Δ computed as above (negative = clutch, positive = gave strokes back):
| Player, event (year) | Pos after R3 | Δ (strokes) |
|---|---|---|
| Jordan Spieth, Masters (2018) — Sunday 64 | 9 | −6.33 |
| Tony Finau, Masters (2018) — Sunday 66 | 15 | −5.67 |
| Rory McIlroy, U.S. Open (2024) — Pinehurst missed putts | 2 | +0.33 |
| Bryson DeChambeau, Masters (2024) — led R1, finished 6th | 5 | +2.00 |
| Will Zalatoris, PGA Championship (2022) — lost playoff | 2 | +3.00 |
| Cameron Smith, Masters (2022) — final group, finished T3 | 2 | +3.00 |
| Brooks Koepka, Masters (2023) — led, shot 75 | 1 | +6.67 |
The famous clutch rounds (Spieth’s 64, Finau’s 66) and the famous give-it-back rounds (Koepka, Zalatoris, Smith) are all visibly in the panel. The pattern lives where you’d expect.
The back nine is a myth
The most romantic version of the choking narrative is specifically about the back nine on Sunday. The lead evaporates over the closing stretch. Amen Corner does its work. Augusta’s 12th hole eats Jordan Spieth.
I re-ran the same regression on Sunday back-nine scoring only, controlling for the same things. After mean-reversion adjustment:
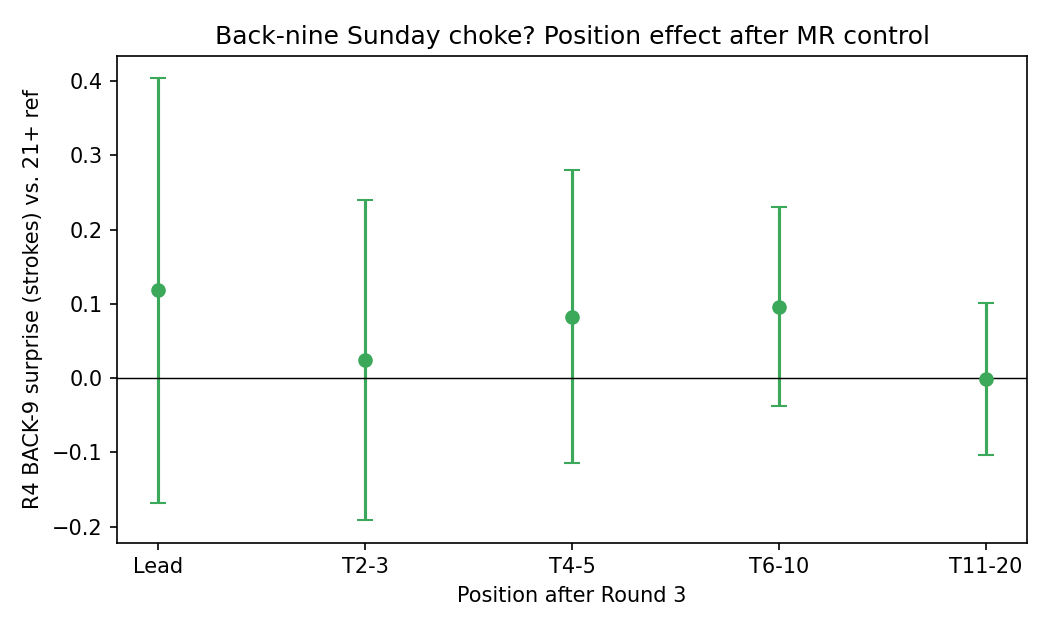
Nothing. The leader’s back-nine cost is +0.12 strokes with a confidence interval that comfortably contains zero. The entire back-nine collapse story, once you strip out regression to the mean, is a story we tell ourselves because we remember the salient finishes and forget the routine ones.
Where does the residual leverage effect live, then? In the front nine and in being-in-the-mix more broadly, not in the back-nine kill shot.
Where clutch matters most
Here is the part I did not see coming. Split the same regression by tournament type:
| Sub-sample | Lead-effect β | n (obs / events) |
|---|---|---|
| All events | +0.43 (p = 0.03) | 23,727 / 329 |
| Non-majors only | +0.40 (p = 0.05) | 21,564 / 298 |
| Majors only | −0.53 (p = 0.47) | 2,163 / 31 |
The contention cost is concentrated in regular Tour stops. In the majors — the four events the pressure narrative is built around — the leader effect is not detectable. The major-only sample is small (31 events, wide confidence interval), so I can’t quite say “the field as a whole is clutch in majors.” But I can say: the data do not support a larger contention cost at majors than at the Travelers, and the point estimate goes the other way.
This is consistent with a selection story. Majors have the strongest fields; by the time anyone reaches the 54-hole lead at Augusta or Pinehurst, they have already self-selected for being able to handle that situation. The cost of contention is something you see at the Sony Open more than at the Masters.
There’s also a temporal split worth noting. The effect is stronger in 2018–2021 (β = +0.59, p = 0.03) and weaker in 2022–2025 (β = +0.32, p = 0.21). With this much data I can’t tell whether the field is getting more clutch on average or whether 2018–21 was the unusual sub-period. Worth revisiting in three years.
Most to least clutch
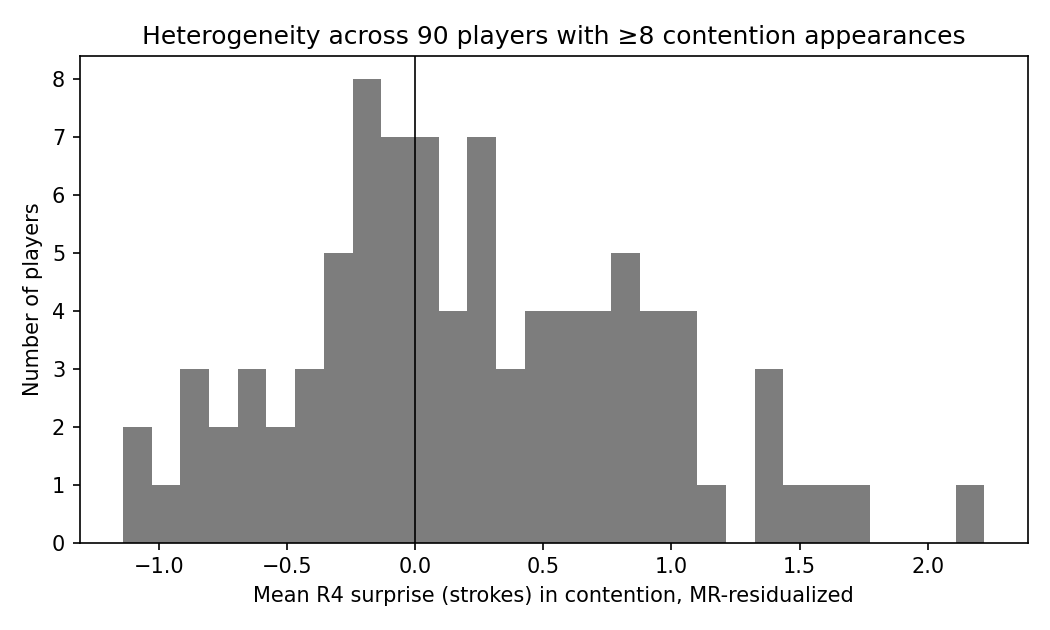
The average effect is small, but individuals differ enough to matter. I residualized each player-tournament Δ on player FE, event FE, and the quadratic in through-R3 score — leaving only the part of each Sunday score that the controls don’t explain — then averaged across each player’s contention appearances. A negative residual means a player consistently outplays their own three-round baseline when they’re in the mix. A positive residual means the opposite.
A first cut using top-5 entering R4 produced an interpretable distribution (figure below) with one problem at the tails: Jon Rahm, a multi-major winner, came in near the bottom of the clutch rankings. Inspecting his rounds revealed why. Rahm routinely converts huge 54-hole leads — at the 2020 Memorial Tournament, for example, he led at −12 through three rounds, shot a +3 Sunday round of 75, and still won by three strokes — and the mean-reversion control, which is a quadratic, cannot fully neutralize the protective Sunday play that very large leads invite. That’s a front-runner effect, not a pressure effect. Of his 30 top-5 appearances in the panel, six were outright wins.
A cleaner cut restricts attention to events where the top-5 spread entering Sunday was four strokes or fewer — actually close races. On that subsample (1,351 contention rounds, 47 players with at least eight appearances), the rankings sharpen.
Most clutch in tight contention (mean residual in strokes, more negative = more clutch; n = appearances):
| Rank | Player | Δ̃ | n |
|---|---|---|---|
| 1 | Tony Finau | −1.59 (t = −2.6) | 12 |
| 2 | Viktor Hovland | −1.22 | 13 |
| 3 | Matt Fitzpatrick | −0.84 | 9 |
| 4 | Webb Simpson | −0.68 | 9 |
| 5 | Patrick Cantlay | −0.56 | 17 |
| 6 | Scottie Scheffler | −0.54 | 26 |
| 7 | Rory McIlroy | −0.44 | 27 |
This is a striking list. McIlroy, who has a public reputation for losing leads in majors (the 2011 Masters collapse and his 2024 U.S. Open finish at Pinehurst being the canonical references), is on the clutch side once you control for skill and mean reversion — interesting because it suggests his most-remembered major Sundays loom larger in memory than his routine tight non-major contention does. Scheffler ranking sixth on 26 appearances is the kind of evidence the underlying narrative will eventually catch up with. Finau’s number leads the list and is the most statistically robust result in the table — the only player whose individual t-statistic clears 2.
Least clutch in tight contention (gives the most strokes back):
| Rank | Player | Δ̃ | n |
|---|---|---|---|
| 1 | Sam Burns | +2.12 (t = 2.6) | 14 |
| 2 | Patrick Rodgers | +1.41 (t = 4.0) | 8 |
| 3 | Jon Rahm | +1.31 (t = 2.4) | 18 |
| 4 | Russell Henley | +1.14 | 10 |
| 5 | Adam Scott | +1.10 | 9 |
| 6 | Rickie Fowler | +1.10 | 9 |
Rahm still appears here even after tightening the sample, which suggests the label is at least partly real and not purely a front-runner artifact — but the caveat above means I’d not lead a story about Rahm with this evidence alone. The Burns and Rodgers rows are statistically robust on their own.
Standard caveats: with 8–27 appearances per player, individual t-statistics are mostly between 1 and 2 in absolute value, with the Finau result and the Burns/Rodgers rows the most statistically defensible. You wouldn’t bet a season on any single name in the middle of the distribution. But the cross-player variance in residualized clutch is several times what noise alone would generate.
What does clutch actually buy you?
A small enough number that the natural next question is: should anyone care?
Yes, because Sunday leaderboards are tight. In the panel, 52 percent of events are decided by a margin of one stroke or less, and 72 percent by two strokes or less. The top of a Sunday leaderboard is densely packed: among the top-10 entering R4, the average density at the leaderboard’s median is 1.7 players per stroke. So 0.4 strokes is worth about 0.7 leaderboard positions — close to one full spot, every time you find yourself in contention.
Translated to money: at the 2024 Masters payout structure, the average per-position drop in the top 10 is $340,000. So 0.4 strokes is roughly $230,000 of expected prize money per Sunday in contention at a major. Even at a regular Tour stop with flatter payouts (closer to $50K–$100K between top-10 positions), 0.7 leaderboard positions is still tens of thousands of dollars per Sunday. For a player like Tony Finau at the top of the clutch rankings, the rough back-of-envelope value of his “clutch premium” over the eight-year window is a few million dollars relative to a typical pro of the same skill — and the inverse for the players at the bottom of the table.
Translated to wins is harder, but consider: more than half of tournaments are decided by one stroke or fewer. A reliable 1-stroke clutch swing on Sunday is enough, over a career, to turn several near-misses into wins — or the other way.
What this isn’t
The biggest threat I haven’t fully addressed is that “in contention” isn’t randomly assigned. Maybe the players who tend to give strokes back also play unusually carefully on Saturday — laying back from pins, two-putting from 25 feet — and that’s why they end up in contention with mediocre through-R3 numbers. The regression treats them as facing similar pressure as someone who got there by playing aggressive and great, but their underlying disposition is different.
Also: this entire exercise uses stroke totals, not shot-level data. The gold standard is ShotLink — every shot, every lie, conditional expectations of strokes from each position (Broadie 2012, 2014). With ShotLink you could ask whether clutch is concentrated in putts inside ten feet versus tee shots — the kind of granularity that maps onto the psychological story, and that Pope & Schweitzer and Hickman & Metz exploit. ESPN’s free leaderboard gives you four numbers per player per week. It’s enough to settle the headline question, not enough to settle the mechanism.
Bottom line
You can observe clutch statistically in golf, but only after you take regression to the mean seriously. The naive Sunday gap between leaders and the rest of the field is 3.5 strokes; the genuine leverage-induced cost is closer to 0.4. The back-nine collapse is something we narrate ourselves into. The cost of contention lives at regular Tour stops more than at the majors. And individual players vary enough that there is a stable, if noisy, ordering of who handles contention well: Tony Finau, Viktor Hovland, Matt Fitzpatrick, Scottie Scheffler, and Rory McIlroy at the top end; Sam Burns, Patrick Rodgers, and (with the front-runner caveat) Jon Rahm at the other.
If a commentator tells you a leader is “due to give back strokes” on Sunday, they’re mostly right — but for the wrong reason. And if they say it about a major, they may not be right at all.
References
- Broadie, Mark (2012). “Assessing Golfer Performance on the PGA Tour.” Interfaces 42(2): 146–165. doi:10.1287/inte.1120.0626
- Broadie, Mark (2014). Every Shot Counts: Using the Revolutionary Strokes Gained Approach to Improve Your Golf Performance and Strategy. Gotham Books. ISBN 978-1592408139
- Connolly, Robert A., and Richard J. Rendleman, Jr. (2008). “Skill, Luck, and Streaky Play on the PGA Tour.” Journal of the American Statistical Association 103(481): 74–88. doi:10.1198/016214507000000310
- Hickman, Daniel C., and Neil E. Metz (2015). “The impact of pressure on performance: Evidence from the PGA Tour.” Journal of Economic Behavior & Organization 116: 319–330. doi:10.1016/j.jebo.2015.04.007
- Pope, Devin G., and Maurice E. Schweitzer (2011). “Is Tiger Woods Loss Averse? Persistent Bias in the Face of Experience, Competition, and High Stakes.” American Economic Review 101(1): 129–157. doi:10.1257/aer.101.1.129
Data and code: leaderboards retrieved from ESPN’s PGA leaderboard API, 329 stroke-play events, 2018–2025. Full replication package — six numbered scripts, all raw and processed data, and the regression output files this post quotes from — is at github.com/scottlangford2/golf-clutch-replication. Every numerical claim in this post is reproducible end-to-end on a laptop in under five minutes.