
Did LIV Golfers Get Worse After They Defected?
Published:
Since 2022, more than thirty PGA Tour pros have left for the Saudi-backed LIV Golf league, lured by guaranteed contracts reportedly worth tens or hundreds of millions of dollars. The complaint from those who stayed has been blunt: LIV’s 54-hole, no-cut, shotgun-start format is “exhibition golf,” and players who take the money will get rusty. The defectors say the opposite — that the lighter schedule lets them practice harder and play fresher. So who’s right?
The clean way to ask the question is to look at the four times a year when defectors and stayers play the same course in the same field on the same days: the majors. I scraped every round of every men’s major from 2018 through the 2026 Masters from Wikipedia — 31 tournaments, ~17,500 player-rounds — and ran a difference-in-differences regression. Each defector’s strokes-versus-the-field is compared, before vs. after they signed with LIV, against the same shift among comparable stayers in the same rounds. Because every player is being compared to the same field on the same day, course difficulty and field strength cancel out.
The headline answer is: on average, defectors got about half a stroke per round worse — but the average hides almost everything interesting. Once you split by player type, the story is much sharper.
The story is in the heterogeneity
Splitting the 30 defectors into three buckets — stars (pre-defection scoring at least 1.5 strokes better than the major field, on average), older (38+ at defection, not stars), and journeymen (everyone else) — gives this:
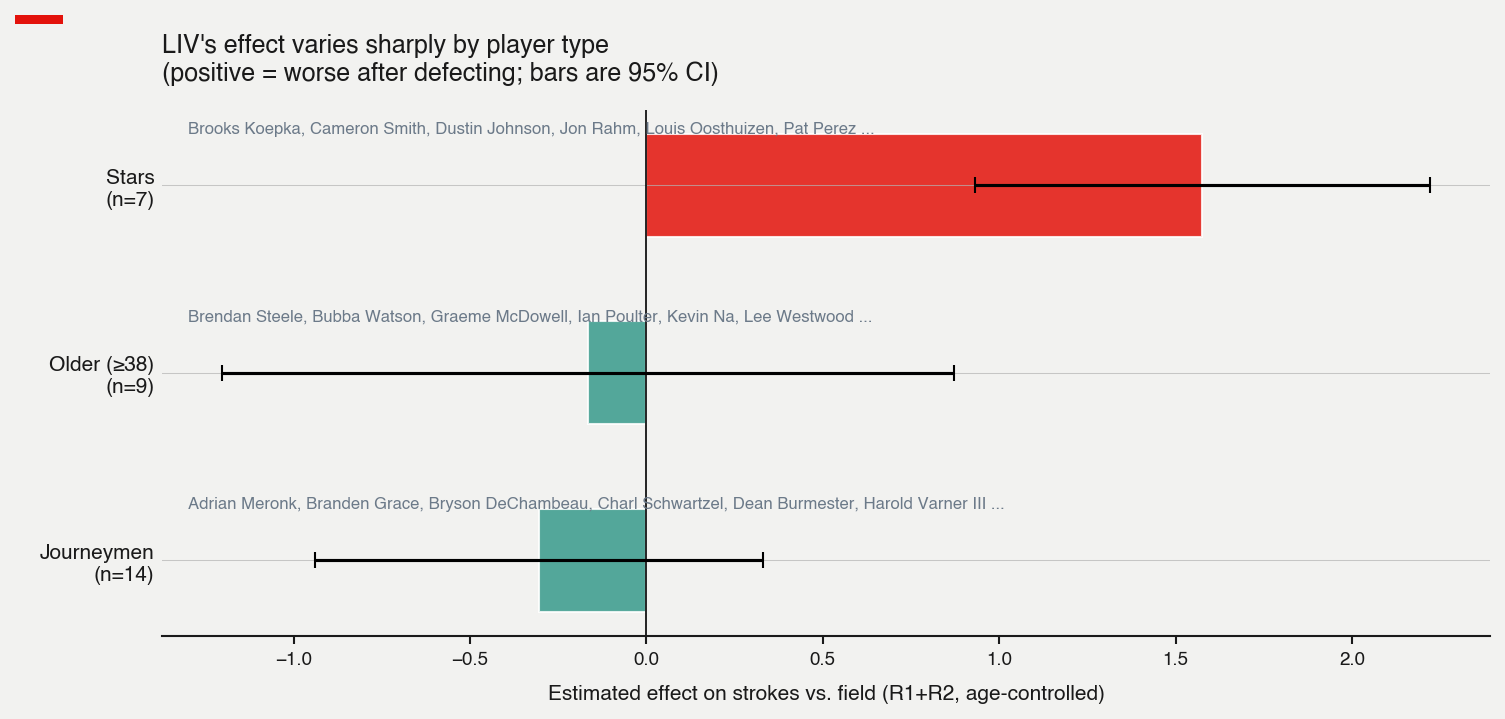
The stars — Brooks Koepka, Cameron Smith, Dustin Johnson, Jon Rahm, Louis Oosthuizen, Patrick Reed, and Pat Perez — got dramatically worse: +1.58 strokes per round at majors (SE 0.33), large enough that the 95% CI clears zero by a wide margin. Translated to a 4-round major, that’s roughly the difference between contending and missing the cut. The older defectors and the journeymen, by contrast, are statistically indistinguishable from no effect (and the journeyman point estimate is actually negative).
The popular narrative — “LIV makes you rusty” — turns out to apply specifically to the players who arrived at LIV at the top of their game. Older defectors were declining anyway; journeymen weren’t good enough at majors for LIV to obviously hurt their relative standing.
How robust is the average effect?
The aggregate +0.48 stroke estimate holds up across specifications:
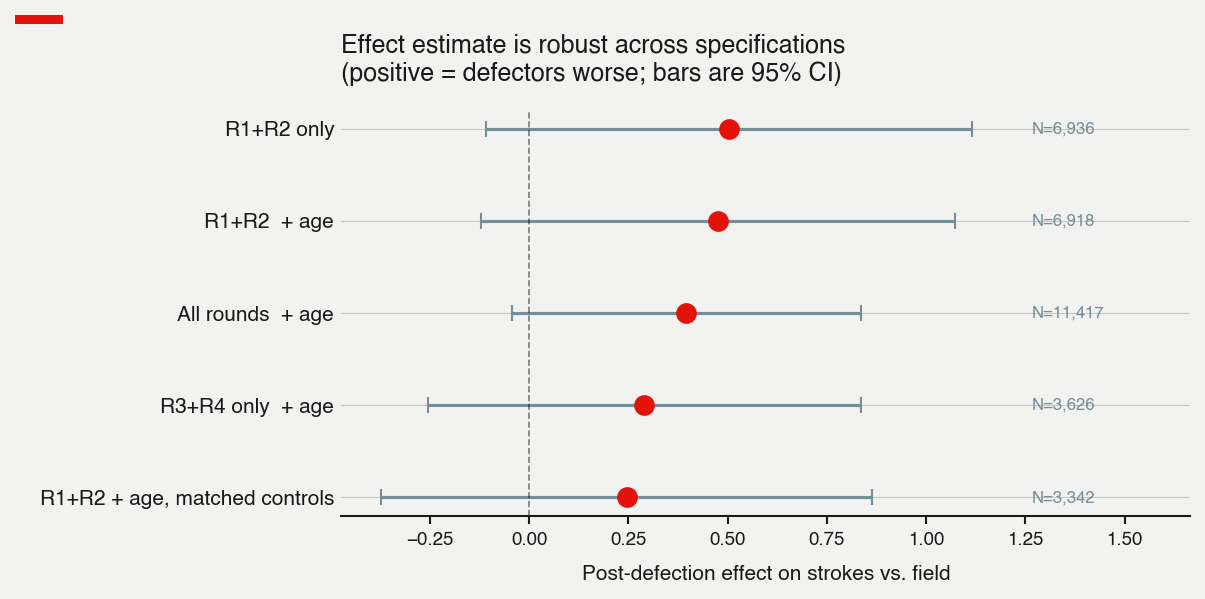
Adding age + age² (to net out normal aging) barely moves the estimate. Restricting to all four rounds pulls it down slightly to +0.40; R3+R4 only gives +0.29. Most importantly, when I build a matched control group — three nearest-neighbor stayers per defector, matched on pre-period skill, age, and major appearances — the estimate falls to +0.25 strokes (SE 0.32). That last spec is the cleanest read because it compares each defector to a handful of stayers who looked very similar pre-2022. Across all five specs the standard errors are wide enough that we can’t reject zero, but every point estimate sits to the right of it.
Cuts
A separate outcome — the probability of making the cut at a major — points the same way:
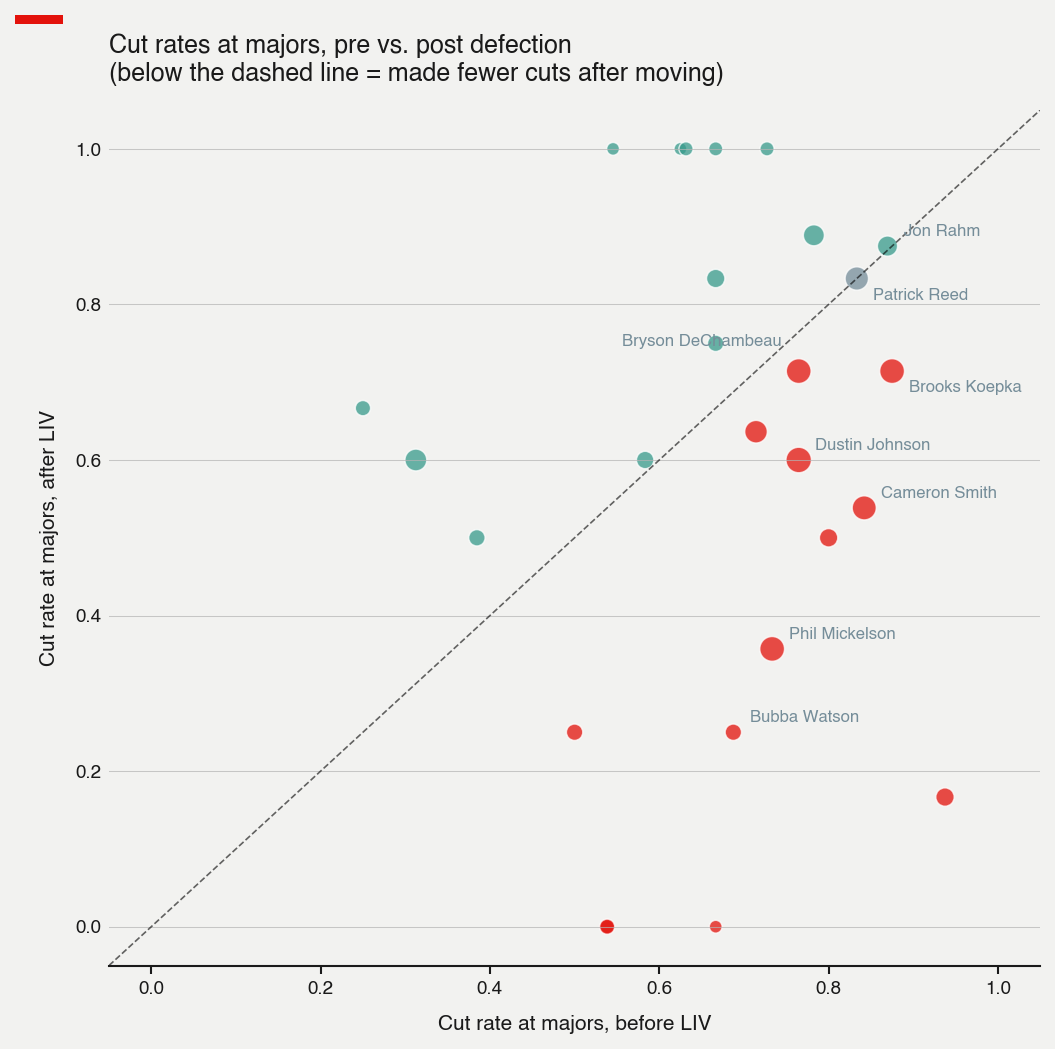
Each dot is one defector; the dashed line is “no change.” Most dots sit below the line. The DiD estimate is a −7.9 percentage point drop in cut probability after defection (SE 5.6). The visual standouts are Phil Mickelson (73% → 36%), Bubba Watson (69% → 25%), Dustin Johnson (76% → 60%), and Cameron Smith (84% → 54%).
Cut rates are tricky for a different reason: many defectors lost OWGR points and major exemptions over time, so the post-period cut rate is conditional on still getting into the major. Defectors who kept showing up were positively selected on quality, which biases the apparent decline downward. A simple Lee-style bound, trimming the top of the post-period distribution to match the appearance rate, says the true effect on cuts could be anywhere from a small drop (−6.9pp) to a much larger one (−57.8pp). The point estimate is the optimistic end of that range.
Bryson DeChambeau is a real counterexample
The clear exception to the “stars got worse” story is Bryson DeChambeau, who became a one-man rebuttal to the rust narrative — and won the 2024 US Open as a LIV member.
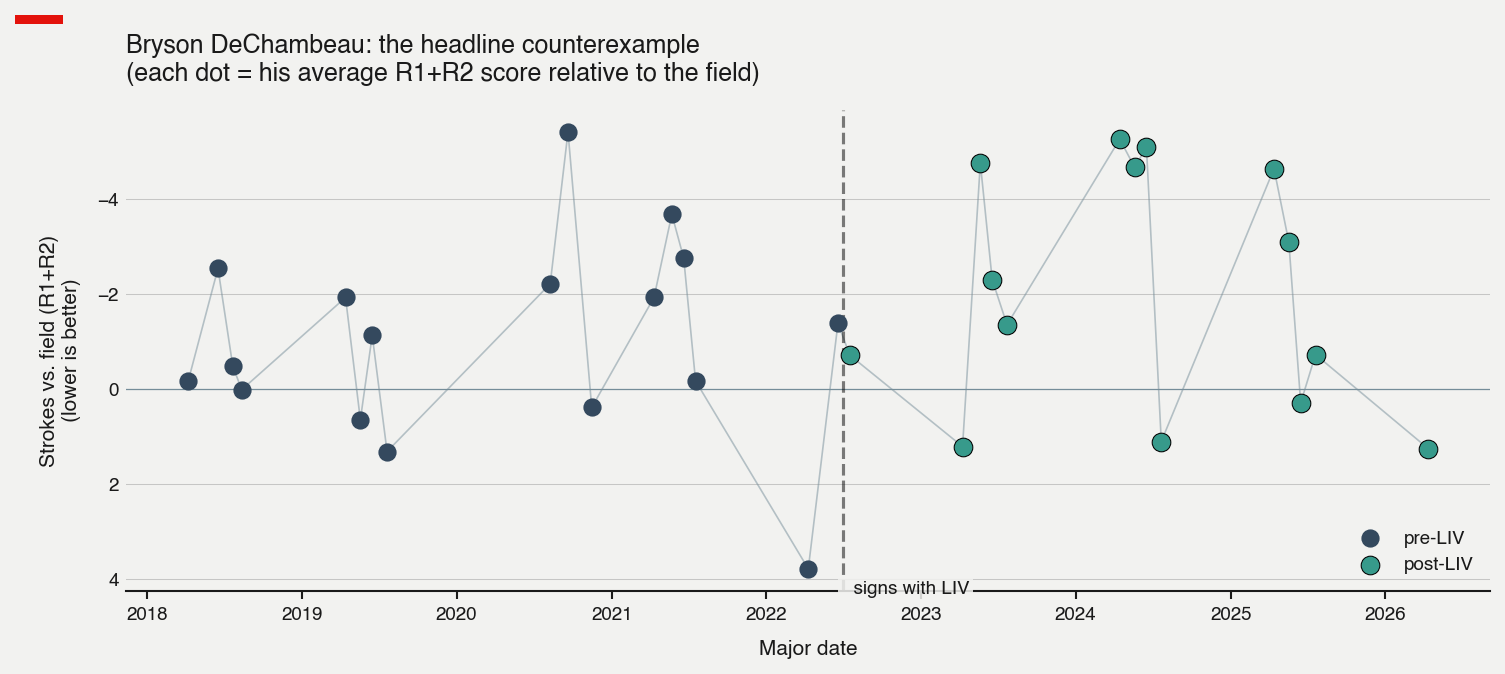
His scoring has been better relative to major fields after the move than before. He’s classified as a journeyman in my buckets only because he was injured and underperforming in the year right before he signed; if you’d asked anyone in 2020 (the year he won the US Open the first time), “star” would have been the obvious bucket. So the existence-proof is real: LIV play does not, by itself, prevent peak major performance. Whatever is hurting Brooks Koepka and Cameron Smith is not just “fewer rounds against good players.”
What this doesn’t tell us
A few honest caveats:
- Major-eligibility selection. The post-period sample is selected on still being invited to majors — which positively selects on play. The Lee bound on cuts says this could matter a lot.
- Pre-trend issue. A formal event study (in the appendix) shows defectors were unusually good three majors before they signed, which fails a parallel-trends test. The matched-control spec is partly designed around this; it gives the smallest estimate (+0.25).
- Mechanism. I can’t tell from this whether the decline is from less competitive play, fewer rounds per year, different course types on LIV, or something psychological. Strokes-gained data (which LIV doesn’t publish) would be needed to decompose.
- Small post-period for late defectors. Tyrrell Hatton, who shows up as the biggest improver, has played only nine majors as a LIV member.
Bottom line
The popular “LIV makes you rusty” claim is mostly true for the stars — Brooks, Smith, DJ, Rahm, Oosthuizen, Reed — who got noticeably worse at majors after defecting, by an amount large enough to materially affect their results. It’s not really true for everyone else: the older and journeyman defectors look indistinguishable from how they’d have done anyway. And DeChambeau is a real existence proof that the right player can be a peak major performer while playing only LIV golf the rest of the year.
If you want one number, it’s: among defectors who were elite before they left, expect about 1.5 fewer strokes of edge per round at majors, going from “regularly contend” to “regularly make the cut and finish mid-pack.” If you’re an older or middling defector, the major-tournament evidence is consistent with no real change.
Code, scraped data, and all figures are in the replication package.
Appendix
Supplementary figures and discussion. Per-defector breakdown, formal event study, distribution view, round-specific effects, and the sample definitions.
A1 — Per-defector breakdown
Each defector’s average strokes-vs-field at majors, before vs. after defection (R1+R2 only, so no cut selection):
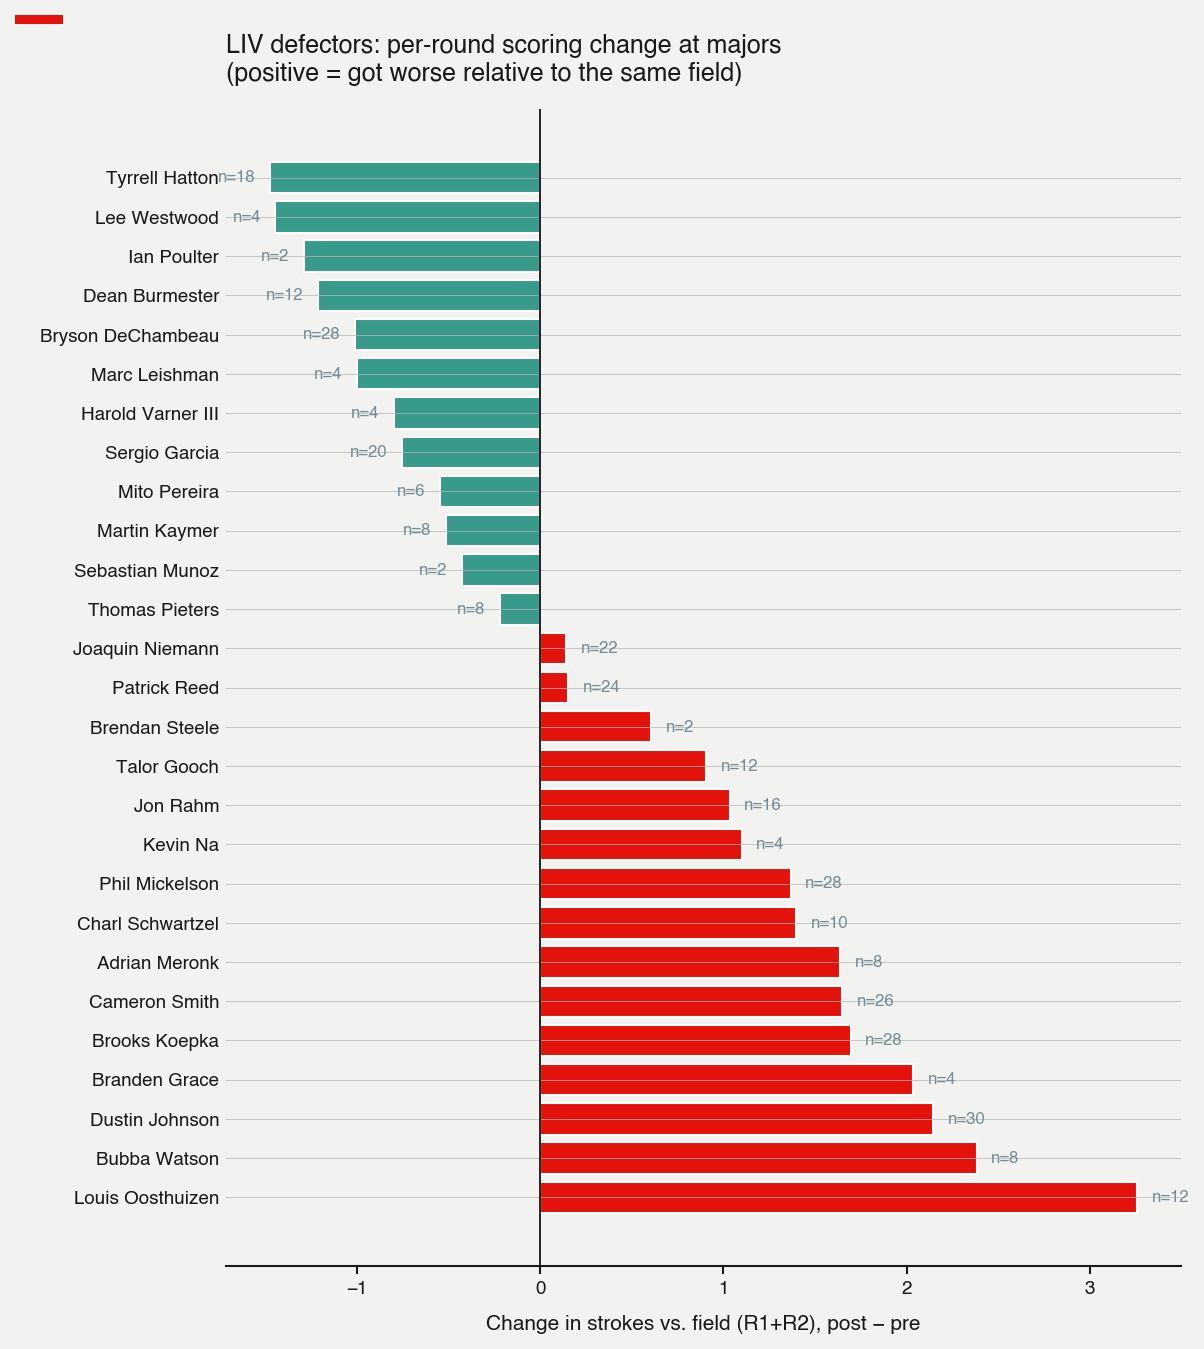
Roughly half the defectors got worse and about a third got better, with the magnitudes among the worst movers (Oosthuizen, Watson, DJ, Grace) far larger than among the best (Hatton, Westwood, Poulter, Burmester). The small-sample defectors (Westwood, Poulter, Munoz at n = 2 rounds) are essentially one major’s data and shouldn’t be over-read. The “n =” labels on each bar are post-defection player-rounds in the R1+R2 sample.
The unweighted distribution explains why the regression gives the picture it does: the worst movers are mostly players who were already very good (DJ, Smith, Brooks) and slipped a lot, while the improvers are journeymen or older players whose pre-period bars were already close to the field mean.
A2 — Formal event study
Letting the data say when the change happened: separate coefficients at each event time relative to defection, with player FE, major×round FE, and an age polynomial as controls. Event time t = −1 (the major immediately before defection) is omitted as the reference period.
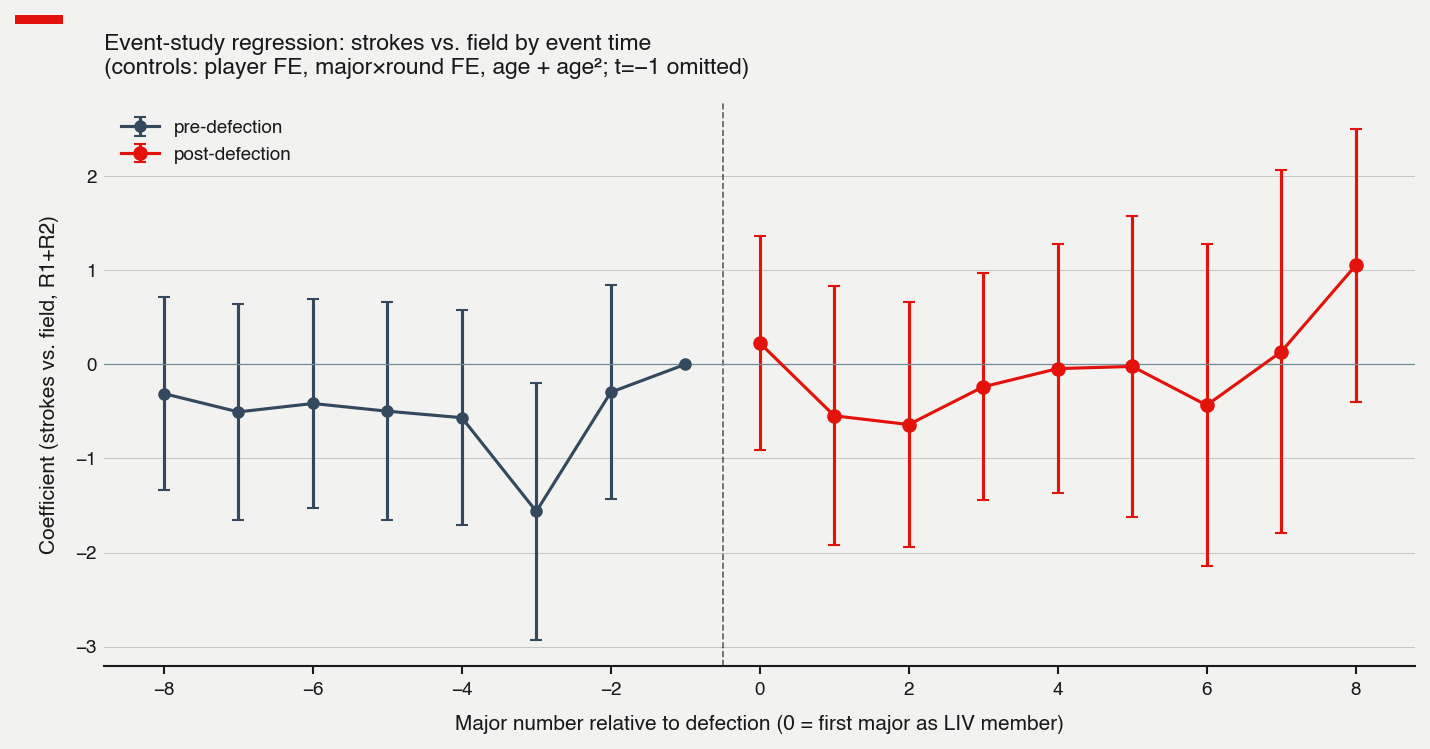
The post-defection coefficients (in red) are mostly positive — defectors are scoring worse relative to the field than they did at t = −1 — but the confidence intervals are wide and there’s no clean step-function jump. Nothing dramatic happens exactly at the defection point; the post-period averages drift positive over time.
The bigger problem is on the pre-defection side. The leads at t = −2 and t = −1 sit close to zero (good — that’s what parallel trends would predict), but the t = −3 coefficient is about −1.6 strokes — defectors were unusually good three majors before they signed. The maximum absolute t-statistic across the pre-period leads is 2.24, which fails a conventional parallel-trends test.
Two stories could explain that dip:
- Reverse causation in selection. A strong major run might have helped attract LIV’s offer (or at least raised the player’s reservation wage). If players sign during or just after a hot streak, the t = −3 to t = −1 window naturally shows above-trend performance, and any decline post-signing partly reflects mean reversion.
- Noise. With ~20 players observable at t = −3 and a single major’s worth of data, a t-stat of 2.24 isn’t extraordinary.
The matched-control specification in the main post is partly designed around this issue. It compares each defector to similar stayers in the same calendar year, which absorbs much of any reversion-to-mean trend that’s common across the cohort. That spec gives the smallest estimate (+0.25 strokes), consistent with the idea that some of the headline +0.48 is mean reversion rather than a LIV effect.
A3 — Distribution view
For readers who prefer raw distributions to point estimates, here’s the density of defector rounds (R1+R2, full field) before and after defection:
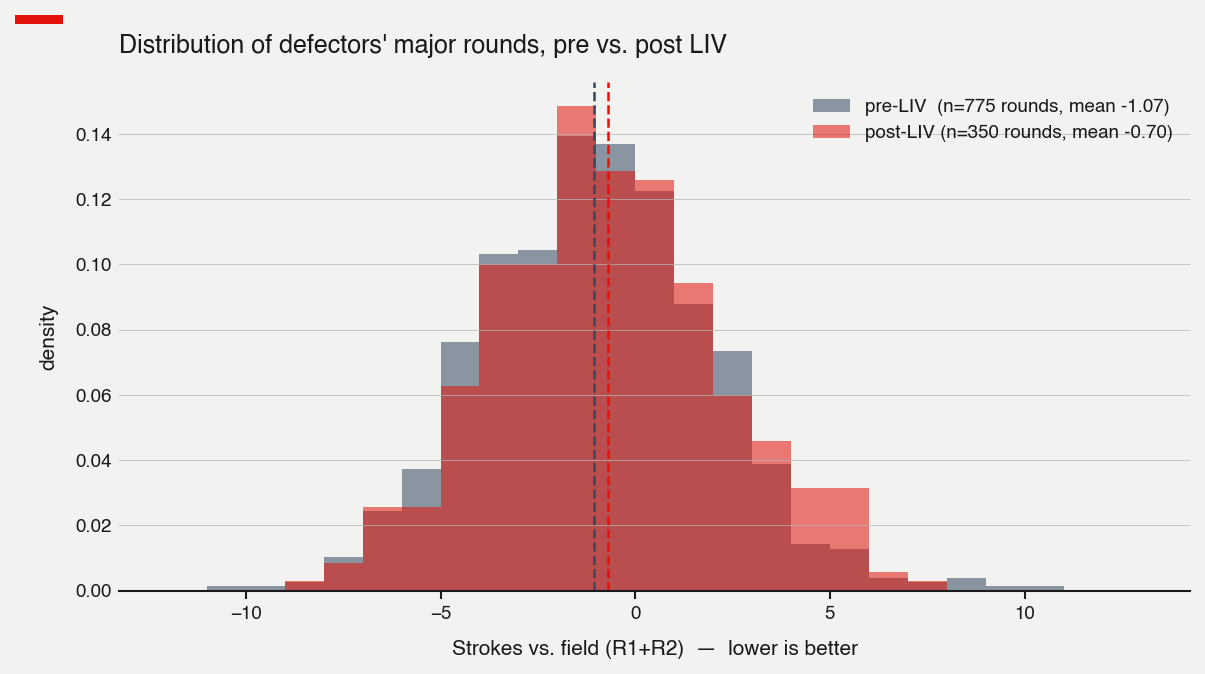
The pre-LIV distribution (grey) is centered slightly to the left of the post-LIV distribution (red), and the post-LIV side has a slightly fatter right tail — more genuine blowup rounds. The means differ by about 0.3 strokes, which is consistent with the regression estimates. The huge overlap is why the standard errors are wide: a defector’s typical round is well within the noise of any single major.
A4 — Round-specific effects
The DiD coefficient broken out by round (each is a separate regression with player FE, major×round FE, and age controls):
| Round | β | SE | N rounds |
|---|---|---|---|
| 1 | +0.31 | 0.34 | 2,904 |
| 2 | +0.60 | 0.38 | 2,871 |
| 3 | +0.34 | 0.41 | 1,516 |
| 4 | +0.36 | 0.39 | 1,514 |
There’s no obvious “Sunday pressure” story — the effect doesn’t ramp up through the rounds. The R2 estimate is the largest of the four, but the differences across rounds are within standard-error distance.
A5 — Sample and definitions
- Universe. All four men’s major championships from 2018 through the 2026 Masters: Masters, PGA Championship, US Open, Open Championship. 31 tournaments, 17,532 player-round observations.
- Defectors. Thirty named PGA Tour pros who signed multi-year LIV contracts between June 2022 and February 2024. Defection date = first LIV event played.
- Outcome. Strokes vs. round-field-mean. The “field” is every player who posted a score that round; for R3 and R4 that’s cut-makers only. Lower scores = better.
- Player typing. Star if average pre-LIV strokes-vs-field ≤ −1.5 (so player was scoring at least 1.5 strokes better than the major field on average pre-defection). Older if 38+ at first LIV event, not a star. Journeyman otherwise.
- Birthdates. Hardcoded for the 30 defectors. For the rest of the field (~500 players), scraped from Wikipedia infobox
class="bday"microformat with a few manual corrections for disambiguation errors (golfers who shared names with historical figures).
Disclosure
This post was drafted with the assistance of Claude (Anthropic). Claude helped with data scraping, statistical analysis, and drafting the narrative text. All analytical decisions, data interpretation, and editorial judgment are the author’s.