
Where Is All of This Going?
Published:
Hays County has roughly 300,000 people today. How many will it have in 2040? In 2060?
The answer depends on who you ask and what method they use. Population projections are not predictions — they are conditional estimates, each built on a different set of assumptions about how growth works. Some assume recent trends continue mechanically. Others model the underlying dynamics. None of them are right. All of them are useful.
I compiled six projection strategies and put them on the same chart. Three are published estimates from official planning agencies — the Texas Demographic Center (TDC) and the Capital Area Metropolitan Planning Organization (CAMPO) — plotted here as reported, not re-estimated. Three are statistical fits I estimated directly from 26 years of annual Census population data. The spread is striking.
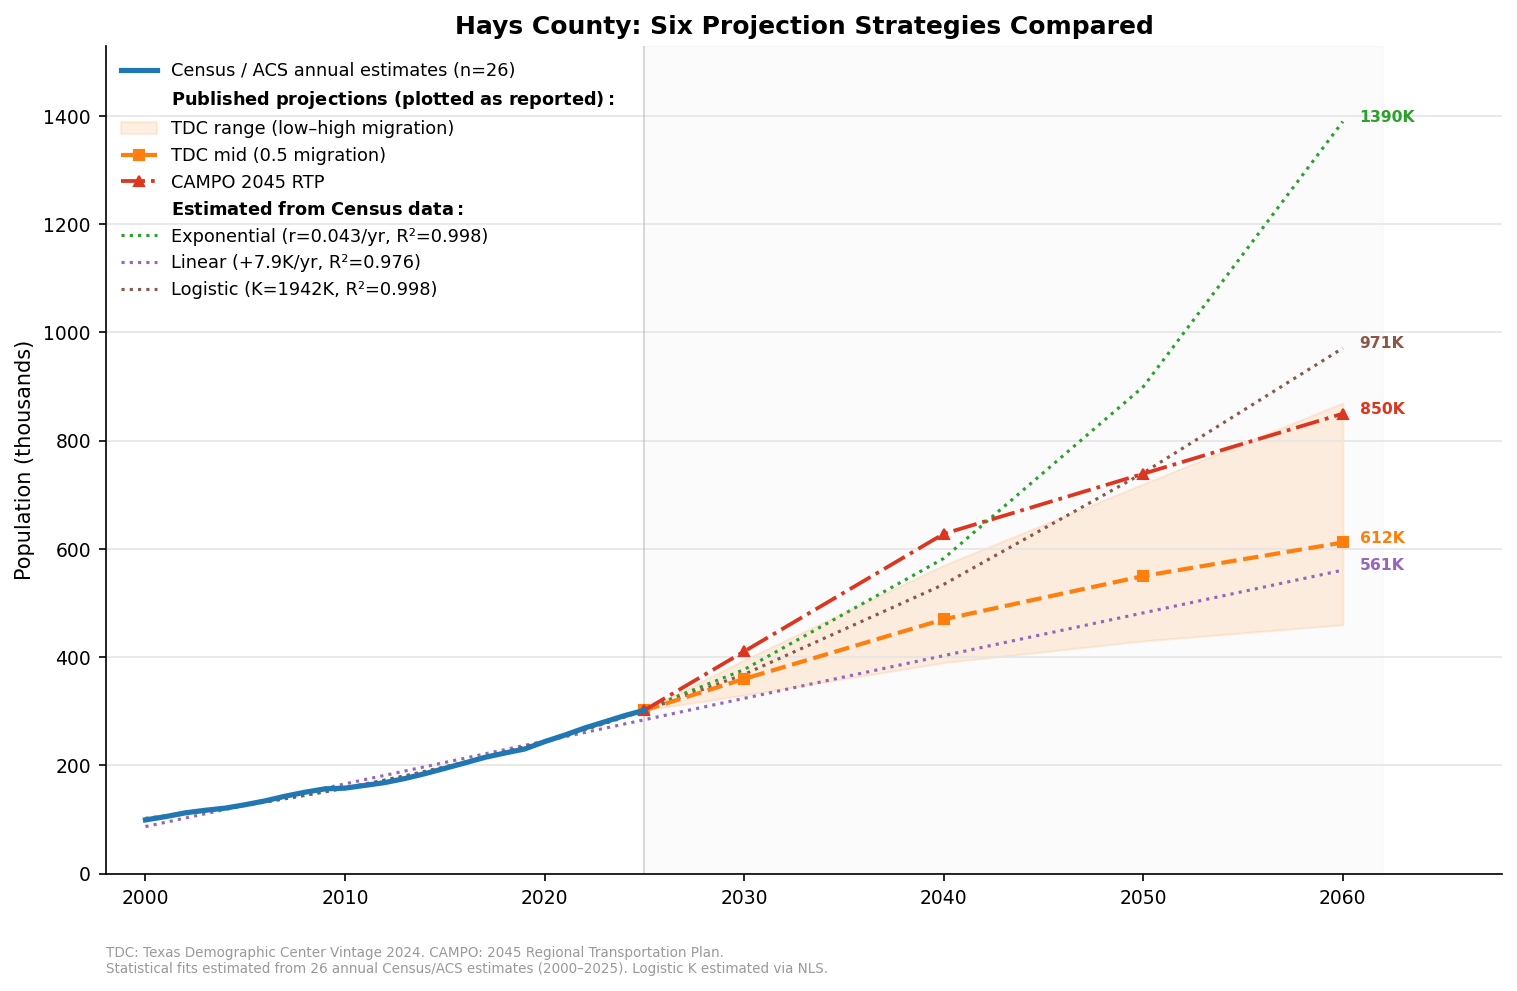
By 2060, the estimates range from roughly 460,000 to nearly 1.4 million. That is not a typo. The range reflects the fact that different methods make fundamentally different assumptions about what drives growth and whether it has limits. Understanding the differences is more useful than picking a single number.
The Official Projections
The TDC — the state demographer’s office — publishes county-level projections through 2060 under three migration scenarios. Migration is the dominant driver of growth in Hays County (far more than births and deaths), so the scenario you choose matters enormously.
The low migration scenario (0.0) assumes net migration drops to near zero — essentially, the county stops attracting new residents. Under this scenario, Hays County reaches about 460,000 by 2060. Growth continues through natural increase and residual momentum, but it slows dramatically.
The mid migration scenario (0.5) assumes migration continues at roughly half the pace of the 2010–2020 decade. This is the scenario most commonly cited in planning documents. It produces about 612,000 by 2060 — a doubling from today.
The high migration scenario (1.0) assumes the 2010–2020 migration rate continues indefinitely. Under this scenario, the county reaches about 870,000 by 2060 — nearly tripling.
The shaded band on the chart shows the range between the low and high scenarios. The TDC’s mid estimate — 612,000 — sits in the middle of that band and is the number most often cited.
CAMPO uses its own demographic forecast for the six-county Austin region. CAMPO’s earlier planning documents projected Hays County could approach 628,000 by 2040, which is more aggressive than the TDC’s mid scenario but consistent with the TDC’s high scenario. CAMPO also projects that the county will more than triple its employment levels over the planning horizon — a signal that the county is expected to develop its own economic base, not just serve as a bedroom community for Austin.
The Statistical Fits
The TDC and CAMPO projections are outputs of cohort-component demographic models — they use age-sex-race specific fertility, mortality, and migration assumptions to project forward. Those models are run internally by the agencies; what is published (and plotted above) are the resulting population estimates, not the models themselves.
A complementary approach is to fit statistical models directly to the historical population series and extrapolate. This is simpler — it ignores the demographic mechanics — but it is fully transparent and replicable. Using the 26 annual Census population estimates for Hays County (2000–2025), three standard curve-fitting approaches produce usefully different results:
Linear fit extrapolates a straight line through the historical data (R² = 0.98). It assumes the county adds roughly the same number of people each year — about 7,900 — regardless of how large it gets. This is the most conservative statistical approach, and it produces the lowest estimate: about 561,000 by 2060. The linear model treats growth as additive, which tends to understate growth in places where the population is large enough to generate compounding effects.
Exponential fit assumes a constant percentage growth rate — the population grows by the same proportion each year, not the same number (R² = 0.99). This is the standard compound-growth model. Applied to the annual estimates, it produces a growth rate of about 4.4 percent per year and a 2060 projection of roughly 1.4 million. That is clearly too high. The exponential model is useful for short-run extrapolation, but it has no built-in ceiling. It assumes growth never slows, which makes it unreliable over long horizons. It does, however, illustrate what happens if you simply extend the county’s recent growth rate forward without accounting for constraints.
Logistic fit models growth as following an S-curve — rapid early acceleration that gradually slows as the population approaches a carrying capacity (R² = 0.99). The carrying capacity is estimated from the data itself via nonlinear least squares, not assumed in advance. For Hays County, the model estimates a carrying capacity of roughly 1.9 million and a 2060 population of about 971,000 — close to the TDC’s high migration scenario and CAMPO’s estimate. The logistic model is attractive because it captures the intuition that growth rates eventually decline, though the estimated carrying capacity is sensitive to the functional form assumed.
What the Spread Tells You
The range — 460,000 to 1.4 million — is not a failure of the methods. It is the methods doing their job. Each one isolates a different assumption and shows where it leads:
- If migration slows dramatically, the county still reaches 460,000 on momentum alone (TDC low).
- If migration continues at half the recent pace, the county doubles to about 612,000 (TDC mid).
- If recent migration patterns hold, the county approaches 850,000– 970,000 (TDC high, CAMPO, logistic).
- If growth compounds at the historical rate without any constraints, the county approaches 1.4 million (exponential — and this is why exponential models are not used for long-range planning).
The exponential model is a useful warning label. It shows what happens when you assume nothing changes — no water constraints, no land limits, no shifts in housing markets. The fact that it produces an absurd number is itself informative. It means that something will have to change. Growth at Hays County’s historical rate is not sustainable indefinitely, and the interesting question is what will slow it down: deliberate planning, resource constraints, or some combination of both.
What the Projections Assume — and What They Don’t
All of these projections share a common limitation: they assume the future will resemble the past in some structural way. None of them account for:
Water supply constraints. The Texas Water Development Board (TWDB) builds its demand forecasts on the assumption that supply will be available. If it is not — if the Edwards Aquifer, the Trinity, or the Guadalupe- Blanco system cannot sustain projected demand — growth will be constrained by physics regardless of what the demographic models say.
Policy changes. A county-level moratorium on water-heavy development, stricter subdivision regulations, or shifts in state annexation law could all slow growth in ways that are not captured by trend extrapolation.
Economic shocks. A recession, a shift in remote work patterns, or a major employer relocation could alter migration flows in either direction.
The affordability gap closing. The growth engine — Hays County being $135,000 cheaper than Travis County — is not fixed. If Austin prices fall or Hays County prices rise, the engine weakens.
The projections are best understood as a range of plausible futures, not as forecasts. The TDC mid scenario (612,000 by 2060) is a reasonable central estimate, but reasonable central estimates have a way of being wrong in both directions.
The Planning Question
The most important thing about these projections may not be the numbers themselves. It may be the gap between the scale of growth they describe and the scale of planning that is currently in place.
Kyle’s comprehensive plan — Kyle 2030 — projects the city reaching about 75,000 by the end of this decade. But Kyle is already approaching 70,000 and has been ranked the second-fastest-growing city in America. San Marcos adopted a new comprehensive plan in October 2024 and projects needing 42,000 to 54,000 additional housing units by 2050. Texas State University enrolled over 44,000 students in fall 2025, up from 40,000 just a year earlier. At the county level, a development regulation rewrite is expected by late 2026.
These are encouraging steps. The question — as with everything in Hays County right now — is whether the pace of planning can match the pace of growth.
The projections say the growth is coming. Whether it lands at 460,000 or 870,000 depends on assumptions that are themselves uncertain. What is not uncertain is that the decisions being made today — about water, roads, schools, and land use — will shape a county that looks fundamentally different from the one that exists now.
Sources
Texas Demographic Center, Vintage 2024 population projections (0.0, 0.5, 1.0 migration scenarios). CAMPO 2045 Regional Transportation Plan demographic forecast. Texas Water Development Board, 2026 Regional Water Planning municipal projections. City of Kyle, Kyle 2030 Comprehensive Plan. City of San Marcos, Vision SMTX Comprehensive Plan (adopted October 2024). Texas State University enrollment data. Hays County Commissioners Court.
Statistical fits (exponential, linear, logistic) estimated from 26 annual Census Bureau population estimates (Population Estimates Program and American Community Survey, 2000–2025).
Replication code: southbound-35/posts/hays-projections
Disclosure
This blog post was written with the assistance of Claude (Anthropic). Claude helped with data research, statistical modeling, and drafting. All analysis and editorial judgment are the author’s.