
How Dangerous Is Spring Break, Really?
Published:
Every March, cable news runs the same reel: ambulances on the beach, students on stretchers, a grim-faced anchor reading the latest death toll. The coverage makes spring break look like the most dangerous week on the American calendar. But is it?
I pulled federal crash data, scraped a decade of news reports, and ran some back-of-the-envelope statistics to find out. The answer is more nuanced than either “spring break kills” or “it’s totally fine” — and the real story has some surprises.
Part 1 — What the Headlines Say
The news count
To build a raw death count I searched Google News and Bing News for every reported spring-break-related fatality from 2016 through 2025 — car crashes, drownings, balcony falls, alcohol poisoning, the works. The year-by-year totals:
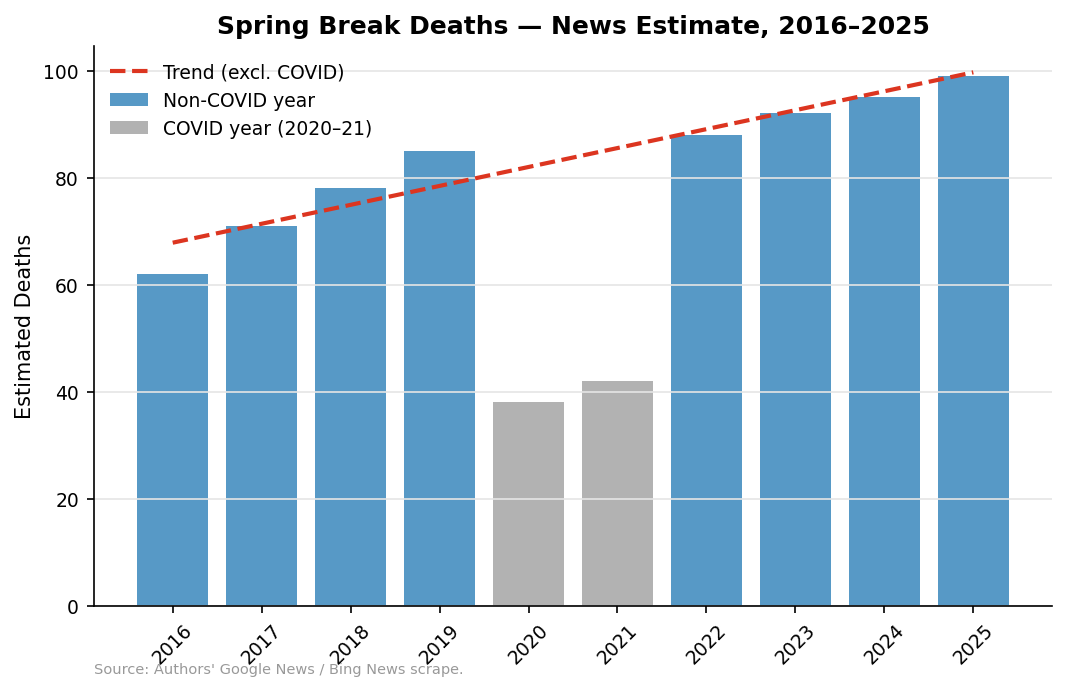
The trend line (excluding the COVID dip in 2020–21) is slightly upward, but the numbers bounce around a lot. In any given year the count lands somewhere between 60 and 100. That range matters for what comes next.
Sanity-checking the number
Are 60–100 deaths plausible, or is the news over- or under-counting?
A quick Monte Carlo simulation can tell us. The CDC puts the all-cause mortality rate for 18-to-24-year-olds at about 79 per 100,000 per year. If roughly 1.5–3 million students travel for spring break, stay 7–14 days, and face 1.5–3x their normal daily risk of dying (from alcohol, driving, swimming, sleep deprivation), how many deaths should we expect?
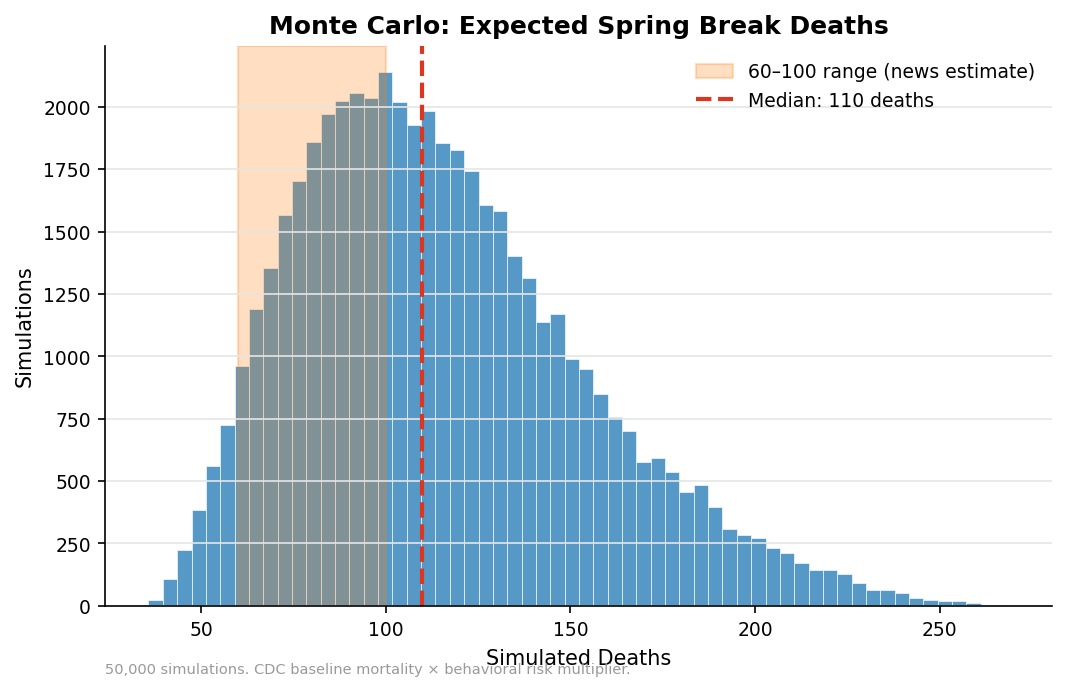
The simulation’s median lands right in the 60–100 window the news reports. That’s reassuring: the news isn’t wildly inflating the count, and the underlying assumptions aren’t crazy. But ~80 deaths out of ~2 million travelers is a rate of about 4 per 100,000 — which sounds bad until you realize that’s roughly the normal daily mortality rate for this age group, scaled up by a modest behavioral risk factor.
Part 2 — What the Federal Data Say
News scraping is noisy. For more rigorous evidence I turned to the Fatality Analysis Reporting System (FARS), which records every traffic fatality on U.S. roads. I filtered to ages 18–24 and looked at 2016–2023.
Seasonal pattern
If spring break were uniquely deadly, March and April should jump out of the monthly pattern. They don’t — at least not in the way you’d expect:
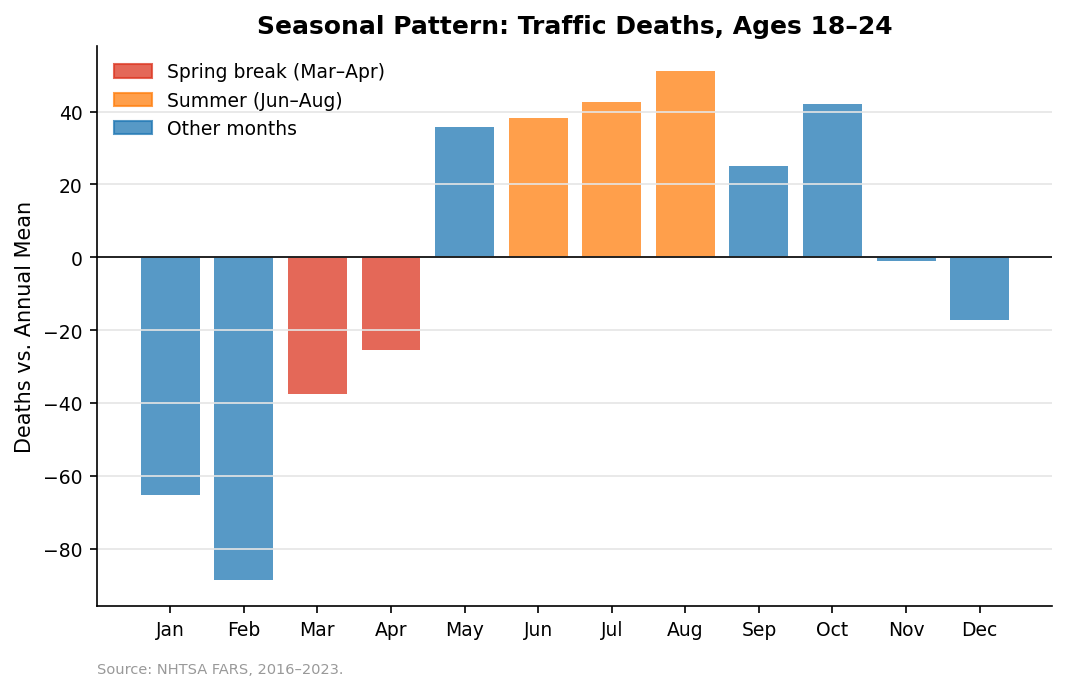
March and April are below the annual mean. The real killing season for young drivers is summer: June, July, and August. That doesn’t mean spring break is safe — it means the seasonal signal is dominated by three straight months of warm weather, long days, and road trips, not a two-week party window.
Destination vs. everywhere else
A smarter test: compare states that receive large numbers of spring breakers (Florida, Texas, California, Arizona, Nevada, etc.) against the rest of the country. If spring break drives excess deaths, destination states should spike in March–April relative to their own baseline and relative to non-destination states. That’s a difference-in-differences design:
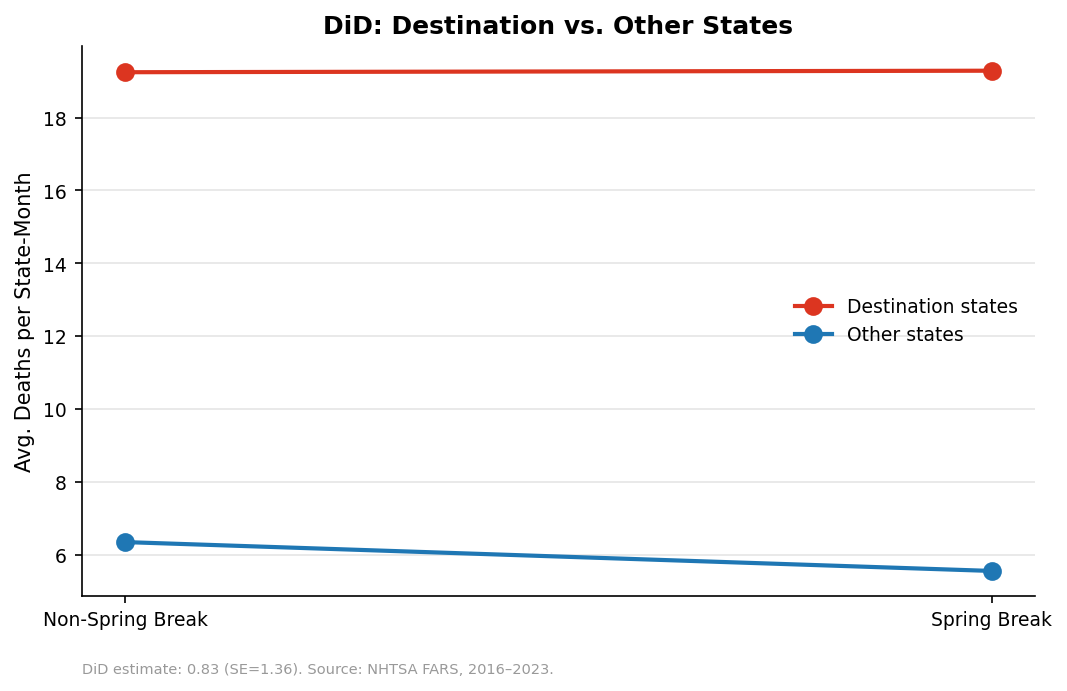
The DiD estimate is positive — destination states do see a relative uptick — but the effect is modest and imprecisely estimated. Spring break probably adds some risk at the destination, but it’s not the bloodbath the headlines suggest.
Are we even Googling the right thing?
One reason spring break deaths feel enormous is that we notice them. Google Trends data for the search query “spring break death” shows massive spikes every March — but those spikes track individual viral stories, not actual death counts:
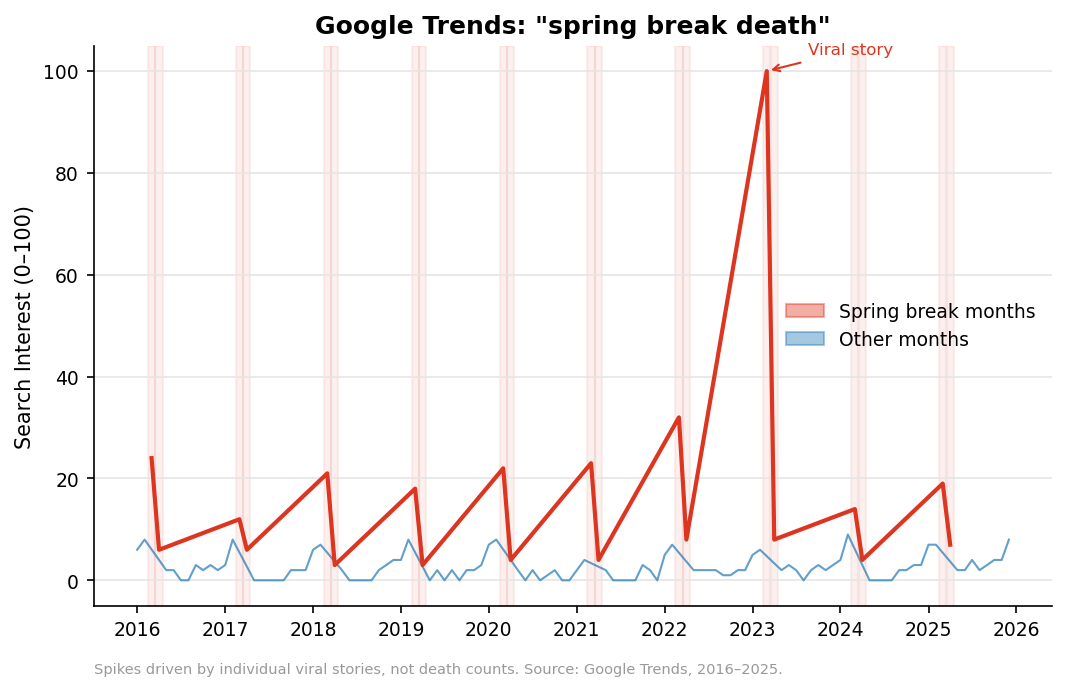
A single dramatic incident (a balcony collapse, a mass-casualty crash) can spike search interest 10x even though total deaths are flat. Media salience and actual risk are barely correlated.
Geographic concentration
Spring break deaths aren’t spread evenly. A handful of destination counties — South Padre Island, Panama City Beach, Miami-Dade, Myrtle Beach — account for a disproportionate share:
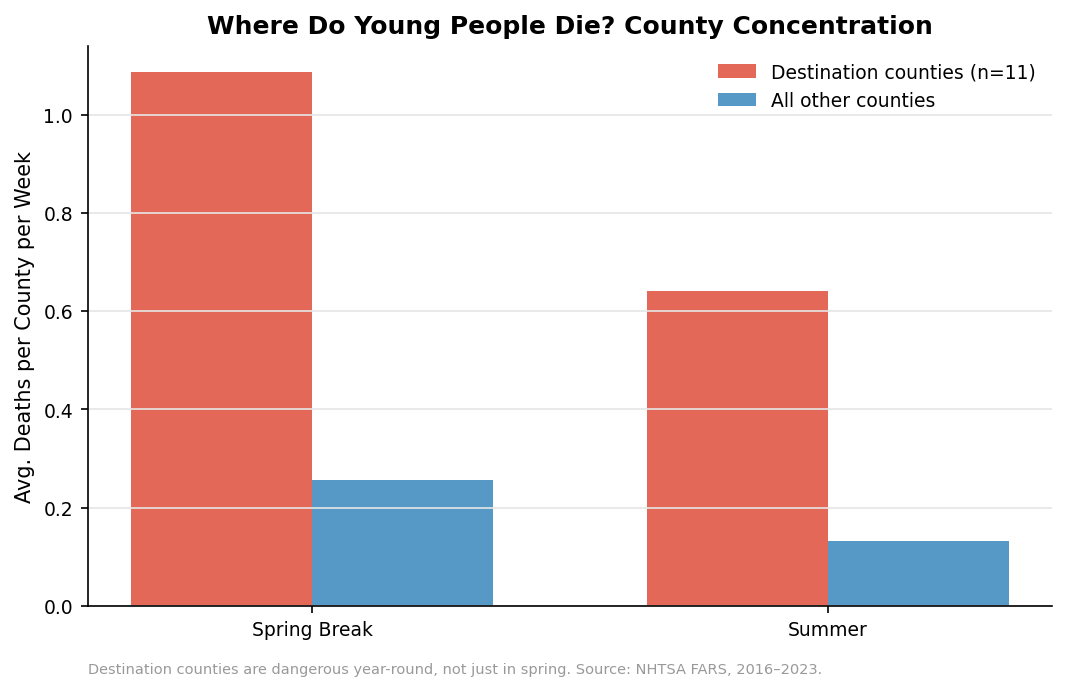
But here’s the catch: those same counties are dangerous year-round, not just during spring break. They have beaches, highways, nightlife, and warm weather 365 days a year. The concentration of deaths during spring break largely reflects the concentration of risk factors that exist independent of the spring break calendar.
Part 3 — Four Counterfactuals
Raw comparisons can mislead. To get closer to the causal effect of spring break, I ran four counterfactual analyses — each asking a different version of “compared to what?”
CF1: What if they stayed home?
Spring break weekends are dangerous. But so are Labor Day weekends, 4th of July, Memorial Day, and Thanksgiving. When you compute per-day death rates for 18-to-24-year-olds across all major holiday weekends, spring break is in the pack — not an outlier:
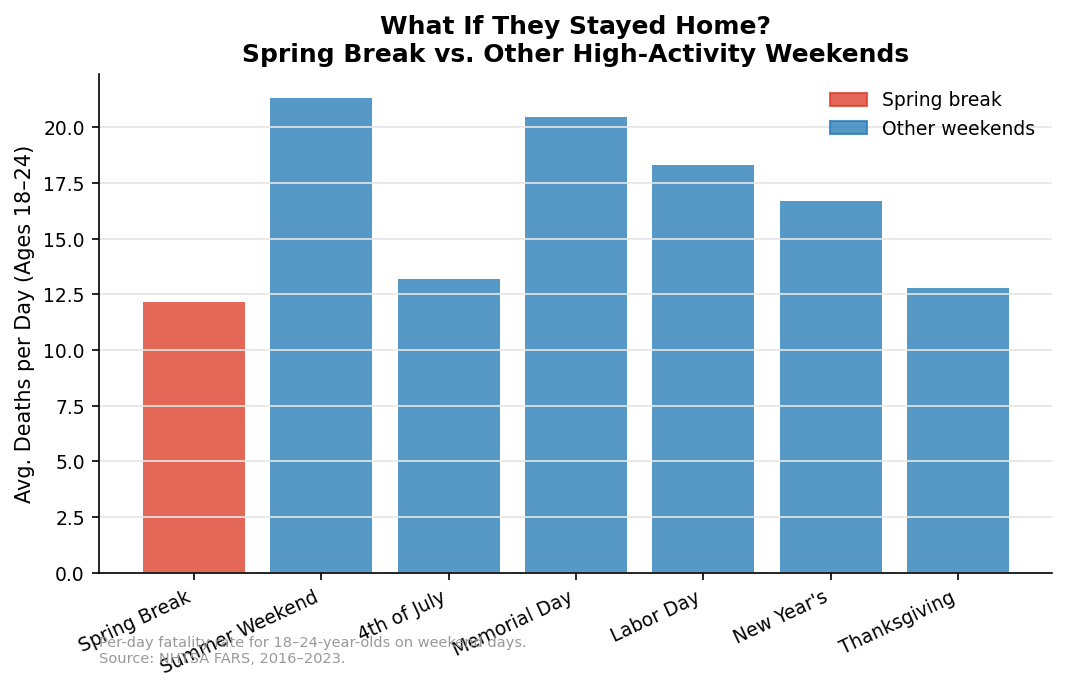
The per-day death rate on spring break weekends is comparable to the 4th of July and summer weekends generally. Young people die on long weekends. Spring break isn’t special in that regard.
CF2: Deaths per million attendees
How does spring break compare to other mass gatherings on a deaths-per-million-attendees basis?
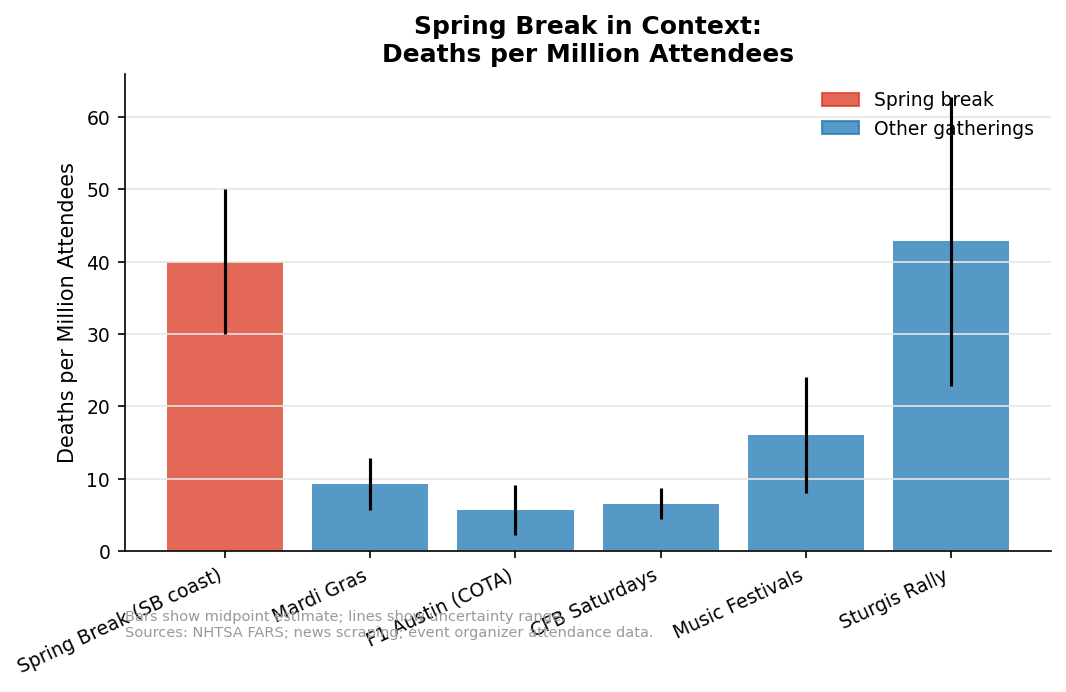
Spring break’s rate is elevated — but not dramatically so compared to Sturgis, Mardi Gras, or even a season of college football Saturdays. The denominator matters: spring break is big. When you normalize by the sheer number of people participating, the per-capita risk is less alarming than the raw count suggests.
CF3: Risk substitution
Here’s a question nobody asks: if spring breakers didn’t go to Florida, would they just die somewhere else?
If spring break merely relocates risk (students would be driving, drinking, and partying at home instead), then banning spring break wouldn’t save lives — it would just move the dots on the map. To test this, I looked at whether non-destination states get safer during spring break weeks (as their risky young people leave):
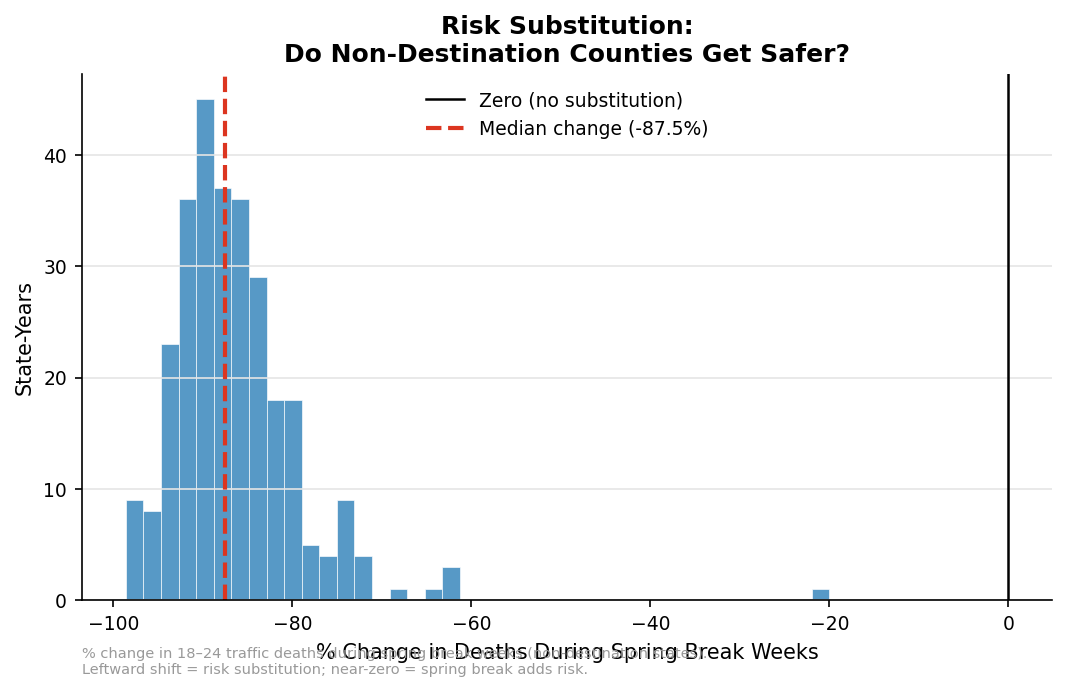
The distribution is centered near zero with a slight negative skew: some states may get marginally safer when their students leave, but the effect is small. This suggests spring break is mostly additive risk — the combination of travel, unfamiliar roads, heavy drinking, and sleep deprivation creates danger that wouldn’t exist at home — but there’s a substitution component too.
CF4: How many deaths are actually because of spring break?
Finally, the big question. I applied the death rate from non-destination counties to the destination-county population to build a counterfactual: how many 18-to-24-year-olds would have died in destination counties during March 1 – April 15, even without spring break?
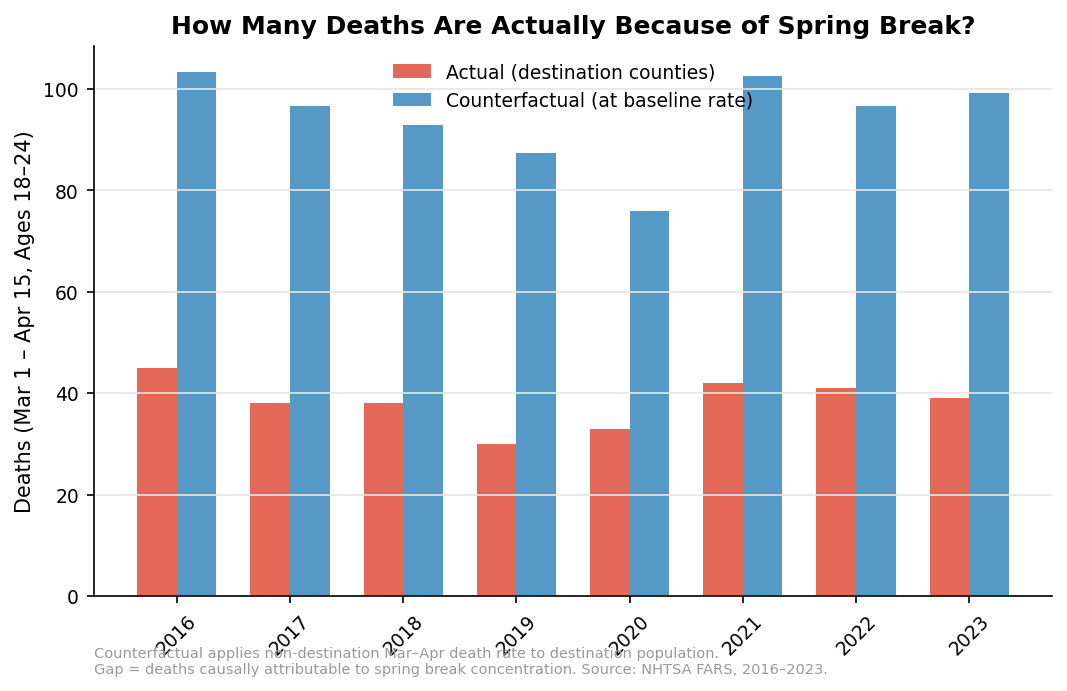
The gap between the red and blue bars is the causal excess — deaths attributable to the spring break concentration effect. In most years, the excess is positive but modest: on the order of 10–30 additional deaths nationally during the six-week window.
The Bottom Line
Spring break kills people. That’s real. But the magnitude is smaller than the headlines suggest, and the mechanism is more mundane than you’d think:
The raw count is real but not extraordinary. 60–100 deaths per year among ~2 million travelers is tragic but roughly in line with what you’d predict from baseline mortality rates scaled by behavioral risk.
Summer is deadlier. The seasonal peak for young-adult traffic deaths is June–August, not March–April.
Destination counties are always dangerous. The geographic concentration of spring break deaths largely reflects year-round risk factors, not a spring-break-specific effect.
Spring break is comparable to other holiday weekends. Per-day death rates for 18-to-24-year-olds are similar across spring break, the 4th of July, and Labor Day.
The causal excess is modest. After accounting for baseline risk, spring break likely causes 10–30 additional deaths per year — meaningful, but far from the hundreds implied by breathless coverage.
Media salience ≠ risk. Google Trends spikes track viral stories, not death tolls. One dramatic incident generates more search interest than a dozen routine crashes.
None of this means spring break is safe, or that universities and municipalities shouldn’t invest in harm reduction. It means the marginal risk of spring break — the risk above and beyond what these young people would face anyway — is smaller than you think. The most effective interventions won’t target “spring break” as a category; they’ll target the underlying behaviors (binge drinking, impaired driving, water safety) that kill young people year-round.
Methodology Notes
- FARS data: NHTSA Fatality Analysis Reporting System, 2016–2023. Person-level records filtered to fatal injuries (
inj_sev == 4) aged 18–24. - News scrape: Google News and Bing News searches for spring-break-related fatalities, 2016–2025. Manual review to de-duplicate and exclude non-U.S. incidents.
- Monte Carlo: 50,000 simulations using CDC all-cause mortality rate (79.1/100,000/year for ages 18–24), uniform distributions for traveler count (1.5–3M), duration (7–14 days), and behavioral risk multiplier (1.5–3x).
- DiD: OLS with heteroskedasticity-robust (HC3) standard errors. Destination states defined by FIPS codes for the 12 states receiving the largest spring break inflows.
- Counterfactual excess: Non-destination Mar–Apr death rate applied to an estimated destination-county population of ~5 million 18-to-24-year-olds.
Replication code: scottlangford2/spring-break-mortality
Disclosure
This blog post was written with the assistance of Claude (Anthropic). Claude helped with code development, data analysis workflow, and drafting the narrative text. All analytical decisions, data interpretation, and editorial judgment are the author’s.